Why Your Services Need Observability

In our current world of massively distributed systems, the number of points of failure in software services has skyrocketed. Due to this, the need for a way to gain insights into distributed systems for error detection, debugging, and business analysis has emerged. Enter buzzword, Observability.
To break down observability, we'll tag along Sophia's journey building a microservice for her health app. One of the API routes allows for uploading images (used when logging meals for example).
def verify_image(file):
	"""Verifies that file is a valid image"""
	return file.ext in ("jpg", "jpeg", "png")

def store_file(file):
	"""Uploads a file to the document storage server, returns URL"""
	pass

def upload_image(file):
	"""API route to upload image"""
	if verify_image(file):
		return store_file(file)
	else:
		raise HTTPException(400, "Invalid image")
One month after deploying this feature, a customer complains that image upload is not working. After spending some time debugging, Sophia figures out that her document storage server had run out of memory and has been down for a whole month! This meant that customers were getting upload errors all throughout the past month, and Sophia's team was none the wiser. After fixing the issue, the team gathers for a post-mortem meeting.
How could this have been detected sooner?
Monitoring
The first pillar of observability is monitoring. This could be as simple as checking that a server is up (health check), setting up alerts when some metric (ex. CPU usage) exceeds some threshold, or tracking more complicated metrics with dashboards.
As an attempt to prevent this issue from reoccurring, Sophia setup an automatic health check that would ping the document storage server every 5 minutes and alert her if it was ever down.
Some solid principles on how and what should be monitored can be found in Google's SRE book.
Probing further
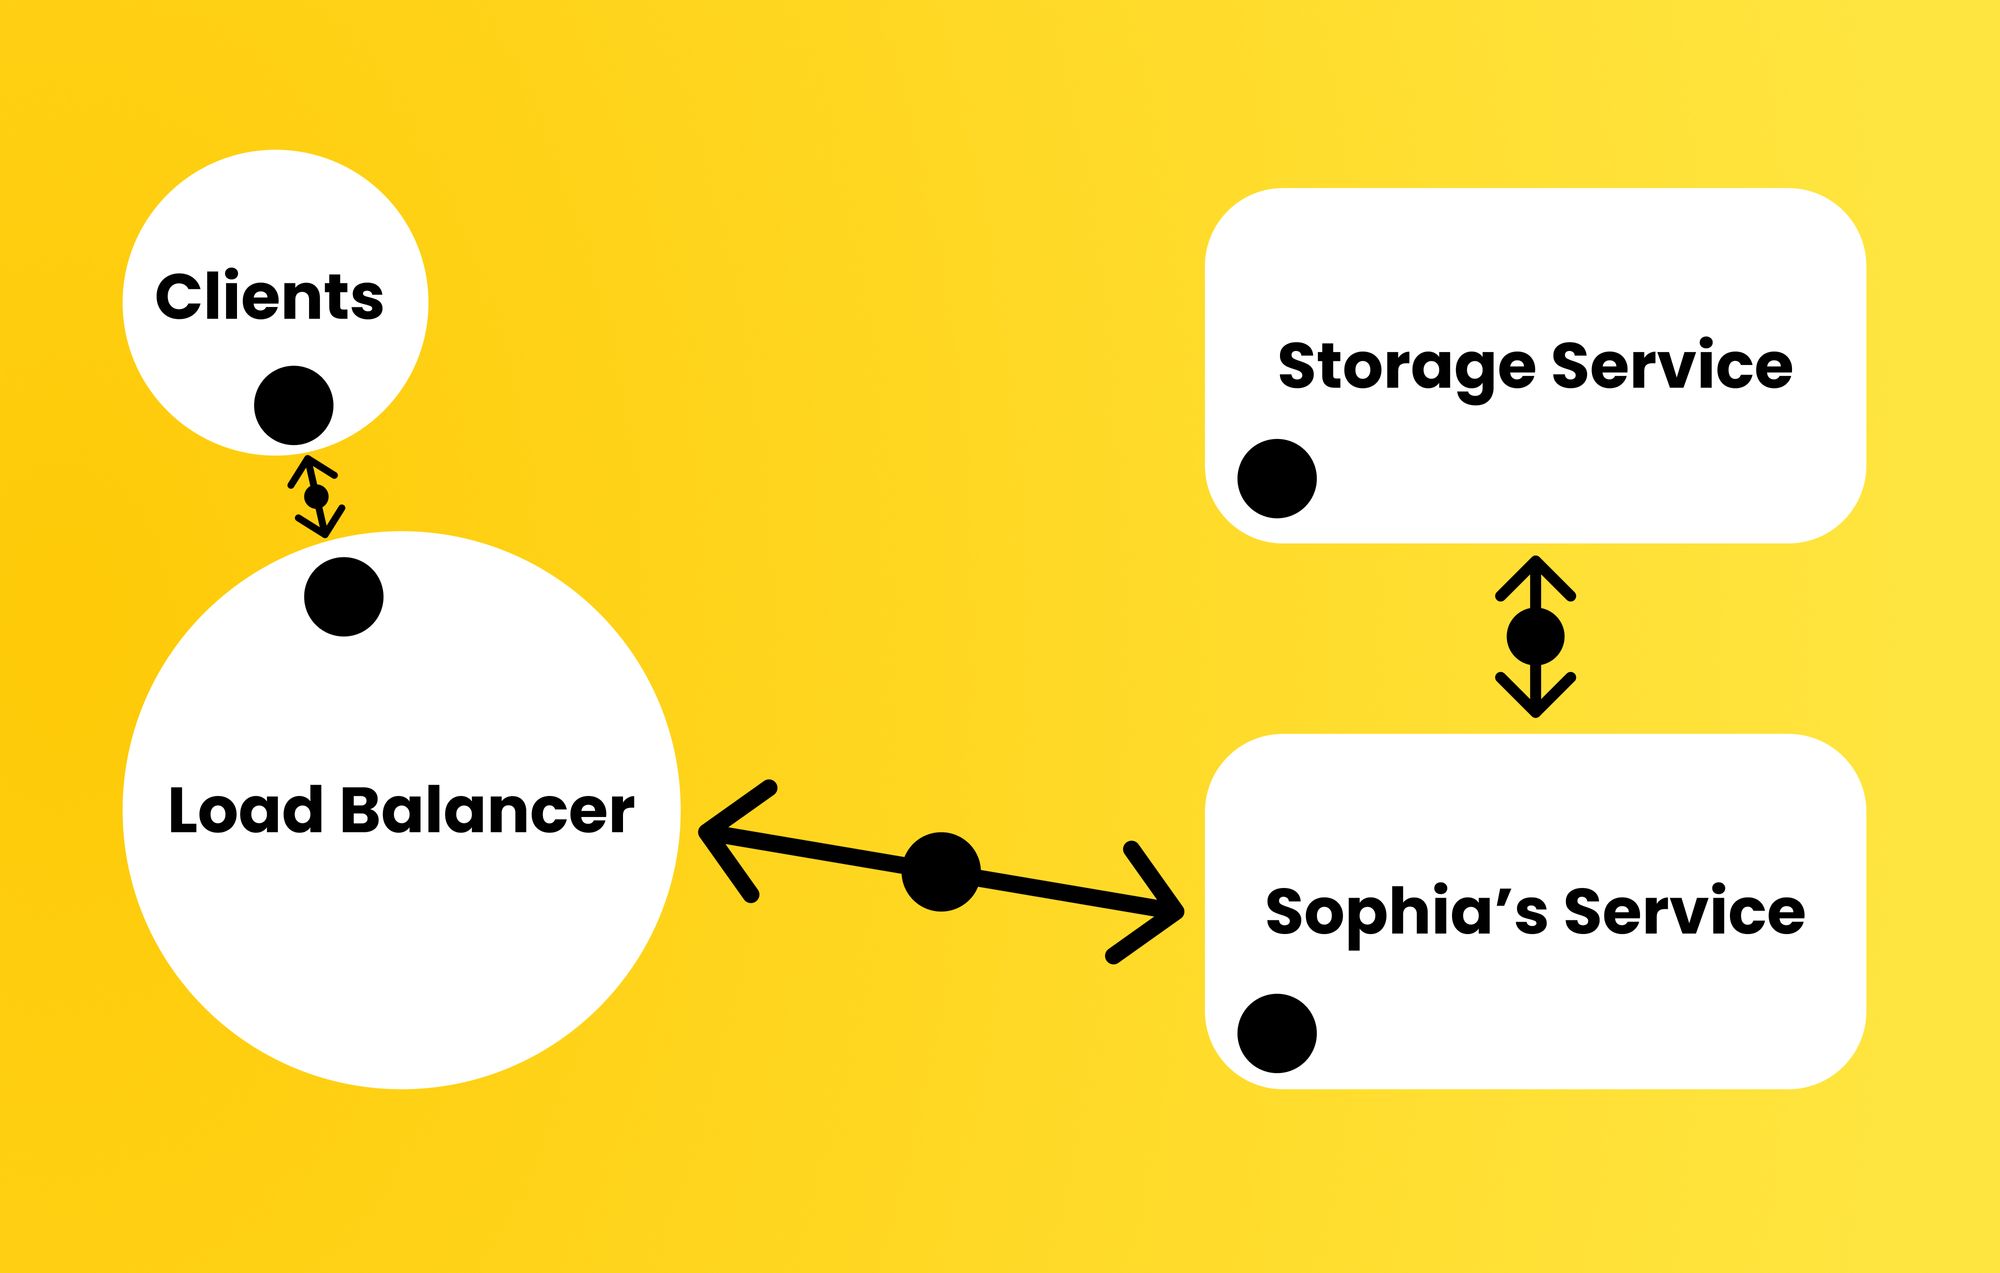
As Sophia's company grew, another team became responsible for storing documents of all types (health report PDFs, images, internal documents, ...). For this purpose, they built a storage microservice and deprecated the old document storage server. Sophia's service also grew, and is now composed of several instances behind a load balancer.
def verify_image(file):
	"""Verifies that file is a valid image"""
	return file.ext in ("jpg", "jpeg", "png")

def store_file(file):
	"""Upload file to storage microservice"""
	return storage_service.upload_image(file)

def upload_image(file):
	"""API route to upload image"""
	if verify_image(file):
		store_file(file)
	else:
		raise HTTPException(400, "Invalid image")
Now a request to upload an image would internally send a request to the storage microservice. Sophia's distributed system was growing in complexity.
Some reports started coming in about images failing to upload, even though some images were being successfully uploaded by other users. Is the problem from Sophia's service? Could it be that the image format is invalid? Or is the issue from the storage service? Could that be overloaded or mishandling saving some image formats? Is the error from the health application itself (frontend)?? Is the load balancer failing to forward some requests? Debugging this has become harder, and this is in fact one of the biggest problems facing distributed systems developers nowadays.
As the system grows, debugging complexity increases at an exponential rate. After spending too long on this, Sophia and the other team realized that the .jpeg image format was not among the accepted formats by the storage microservice, even though it was a valid format in Sophia's validation function. Post-mortem organized, questions asked.
How do we detect such a bug before users report it? How do we debug this without guesswork? What can we do to reduce the search space from too many points of failure to just a few?
Tracing and Logging
What we need here is the second and third pillars of observability, tracing and logging. A trace represents the journey of a request as it propagates through a distributed system. By tracing requests, we can also monitor them and create alerts when we have a significant number of failures for a certain route.
With this tool, Sophia setup a tracing library (ex. OpenTracing) and connected that to a dashboard (ex. Jaeger Tracing). From this dashboard, her whole team can see aggregate request statistics, like some image upload requests failing before customers report anything. They can also trace requests through their system, and directly see that the failures are coming from the storage microservice. Notice how much the problem search space has been reduced.
Note that aggregating these statistics is really important, as Sophia's "service" is actually bunch of services acting as one using a load balancer. Traditional debugging is no longer sufficient in this case, as the problem could be caused by the distributed nature of the system and not be replicable in isolation!
As for logging, Sophia setup some logging functions to log exceptions after catching them. Her team also used these loggers to add informative logs throughout the application and routes, logging the request ID with each call. They aggregated these logs using some logging aggregation service (ex. Logstash). Log aggregation is necessary since the service is actually a bundle of services, and examining every instance's logs is simply not feasible. Searching logs for a particular request ID to complement the traces is also helpful when debugging. This might very well allow us to find the problem without digging any deeper.
One more?
One day, while a product manager was uploading a meal image, he noticed that the upload was exceptionally slow. He remembered trying it the other day and it was at least twice as fast. Naturally, Sophia was called and the bug was logged. That seemed strange to Sophia, as none of her teammates touched the image upload code.
The slowdown had to be coming from the storage microservice. After contacting them, it turns out that they had added a compression mechanism to the upload route, and accounted for the slowdown. Naturally, Sophia mentioned that the slowdown was affecting their customers, and that the compression should take place after the upload is done as a background job.
This one's a tricky one. How could they have known sooner? How can a team detect such performance regressions as soon as they happen? (Without adding performance end-to-end tests that is!)
The answer to that is by monitoring and analyzing request-response times. Statistical anomalies can be attributed to performance regressions/improvements. Setting up such a system is way easier than it sounds thanks to open source. Tools like Jaeger tracing offer root-cause analysis out of the box. Another very powerful open source tool that I haven't mentioned is Elastic APM.
Larger companies that ship B2B software and have to deliver on performance would instead run performance tests (E2E tests with stats that are compared to historical stats), but that is a very tiny portion of software when compared to what's out there.
Wrapping Up
When developing distributed systems, observability becomes a key part of the stack. With complete observability over their services, Sophia's team reaps many benefits:
- Business developers automatically get API usage analytics, allowing them to make data-backed decisions about what direction to take their product in (ex. unused meal logging image upload might indicate that developing an image analysis feature is not worth the effort)
- Engineers get alerts when any of their services need their immediate attention (ex. servers down, service overloaded, ...)
- Debugging time is massively reduced, as tracing and logging help pinpoint the source of the problem
- Analyzing traces and API route metrics allows for detecting regressions due to recent code changes (ex. image upload taking twice as long after last deploy, which means that change had a massive performance impact)
As a final note, there are many services that offer plug-and-play observability, which would involve installing an 'agent' on all your instances and easily integrating a library in your codebase. Some examples are Instana, DataDog, and Stackify, all of which I've personally tried and had a good experience with. Their integrations are equally easy and smooth, however they differ in features. One of those features is continuous profiling, which is worthy of its own post. This ease of integration has made observability accessible even to the busiest of teams.
Further Reading
- Google SRE Book - Monitoring Distributed Systems
- Microservices in Action - Chapter 11, 12
- The Problem with Logging - Jeff Atwood
You can find me on Twitter every day @iamramiawar. For more content like this, be sure to subscribe below!